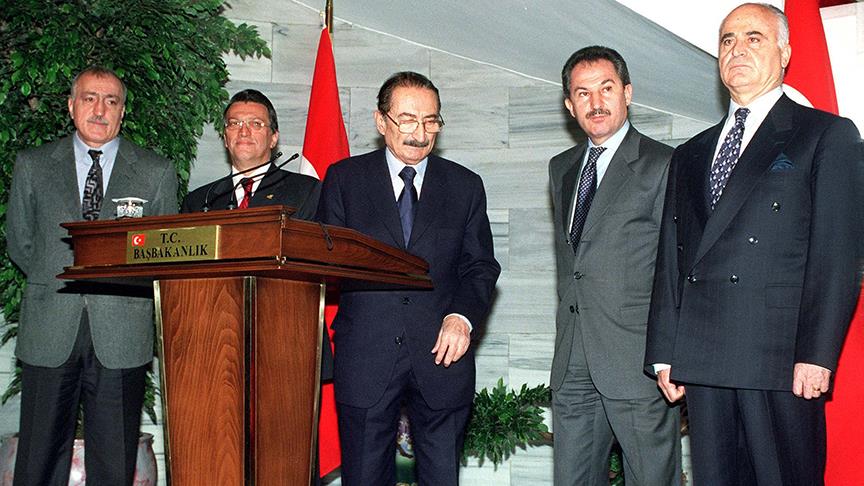

Türkiye’s former Prime Minister Bülent Ecevit’s (in the middle) coalition government AnaSol-M lasted only three years and dissolved in 2002 as the country was tested by 2001 financial crisis.
High inflation and increasing poverty have become our most significant economic issues. Consumer inflation in June is 78.6 percent, food inflation is 93 percent, and producer inflation is 138.3 percent. The 2022 inflation rate under President Recep Tayyip Erdoğan’s rule has exceeded the inflation rate of former Prime Minister Bülent Ecevit’s term in 2001, which was one of the most severe financial crisis of the country’s history that lead to the coalition government to dissolve.
The suffering of the wage earner continues
The numbers are scary enough. Still, let us put it in perspective. Indeed, the first thing that comes to mind is comparing the new minimum wage adjustment with the inflation of the first six months, and I have already made similar comparisons using some graphs. Let me highlight this significant subject by only giving a few numbers this time.
Effective from July, the rise in the minimum wage is 29 percent. However, from the beginning of the year to the end of June, consumer prices increased by 42.3 percent, and food and non-alcoholic beverage prices by 48.1 percent, respectively. In other words, the rise in the minimum wage did not prove to be a fix for the minimum wage earner.
Which is higher?
Comparing what is happening today with the 2001 crisis is also very enlightening. Murat Yetkin suggested me look at inflation from this perspective. It turned out to be an excellent suggestion; three striking facts emerge. The first two are about inflation, and the third is about the exchange rate.
Firstly, the highest inflation after the 2001 crisis was 73.2 percent, the inflation of January 2002. Then, thanks to the Transition to Strong Economy Program, it went down rapidly, though that decline is not our subject. However, the current inflation is 5.4 points above this peak for the time being. That said, it is for now, and it seems this gap will widen.
Steeper increment than 2001
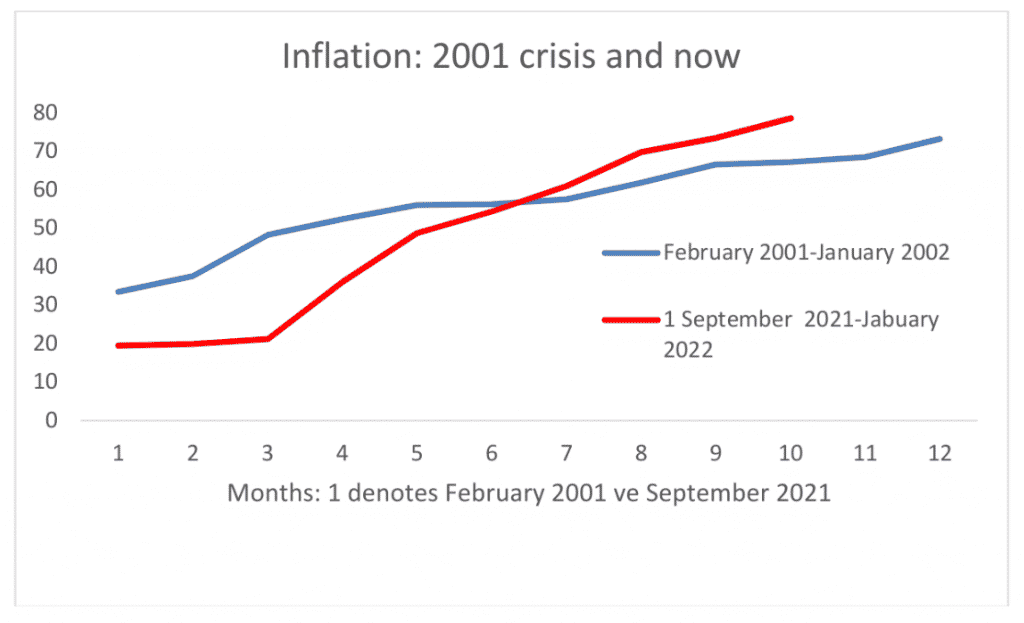
The second striking fact is about the rate of increase in prices, not the level of prices. Graph1 shows the course of inflation in the February 2001–January 2002 and September 2021–June 2022 periods. The numbers on the horizontal axis indicate months, and ‘1’ represents the first month of each period.

Why these periods? February 2001, because with the program implemented in January 2000, inflation dropped significantly and fell to its lowest level in February: 33.4 percent. January 2002, because it is the peak of the post-crisis period. The start of the second period is September 2021 because it is the month when the current crisis started, triggered by the rate cuts.
Hold tight: the inflation increased by 40 points in the twelve months after the 2001 crisis, which deeply shook the Turkish economy and caused the political parties of the coalition government to lose the elections nearly two years later. It has now increased by 59 points in just the last ten months. Moreover, it will surge even more.
Is it under control?
Furthermore, the first graph is striking. While inflation was below its 2001 level at the beginning of this current inflationary period, it quickly caught and passed. It is not to be glossed over with phrases such as “we have it under control” or “it will start to decline in December.” After all, for inflation to not decrease in December, it must upsurge so that it would overshadow its current resurgence.
Such as, prices increased by 13.6 percent in just one month in December 2021. At the end of this year, that high value will be removed from the annual inflation account: there will already be a ‘mechanical’ decrease in inflation. For annual inflation not to fall below its November value in December, the monthly price increase must be higher than 13.6 percent in December 2022, which is synonymous with “catastrophe.”
What about the exchange rate?
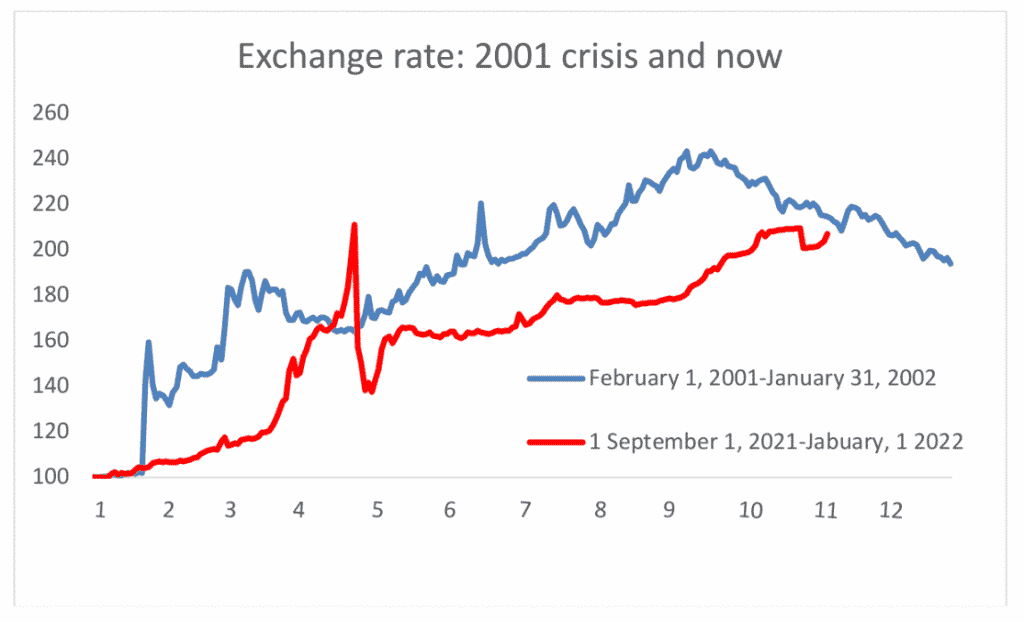
Compared to the 2021 crisis, the third frightening fact is as follows: Despite all the depletion of reserves, the level we have reached in the dollar exchange rates is almost the same as the level made after the first ten months of the 2001 crisis. Moreover, after the Transition to a Strong Economy Program was implemented in May 2001, there was no foreign exchange intervention for a long time.
The second graph has this assessment. It exhibits daily exchange rate movements. To make the comparison more effortless, I take the first day’s exchange rates of both periods mentioned above as 100. I calculate the other exchange rates of the period by this value of 100; in a sense, I am creating a dollar rate index.

Pay attention to one more fact about the exchange rate. When a sound economic program is implemented, the exchange rate decreases without the need for any currency intervention. Those with watchful eyes must have noticed: This decline begins in mid-September 2001 and continues until the end of the period mentioned above, uninterrupted.
What is next?
As long as the current economic policy continues, unfortunately, apart from the ‘mechanical’ and temporary decreases that I mentioned above, it is unlikely for inflation to decrease because of three reasons:
- The exchange rates tend to rise.
- Turkey’s risk premium is over 800 basis points, very high.
- The increase in the producer price index is 138 percent: A phenomenon that will push consumer inflation higher after a while.
Under the condition that I have mentioned (as long as the current program continues), the only thing that will restrain the upward trend in inflation will be a drop in commodity prices in international markets, especially energy prices.


